
Your favourite AO simulation has terminated, the Strehl ratio is reported at 96.1%, and the world appears to wear all rosy colors. But is it really that good? What is the contrast that can likely be achieved through angular differential imaging at 5 λ/D? How has your system been dealing with pupil fragmentation, abundant in next generation extremely large telescopes? What do the spatial and temporal power spectral densities look like?
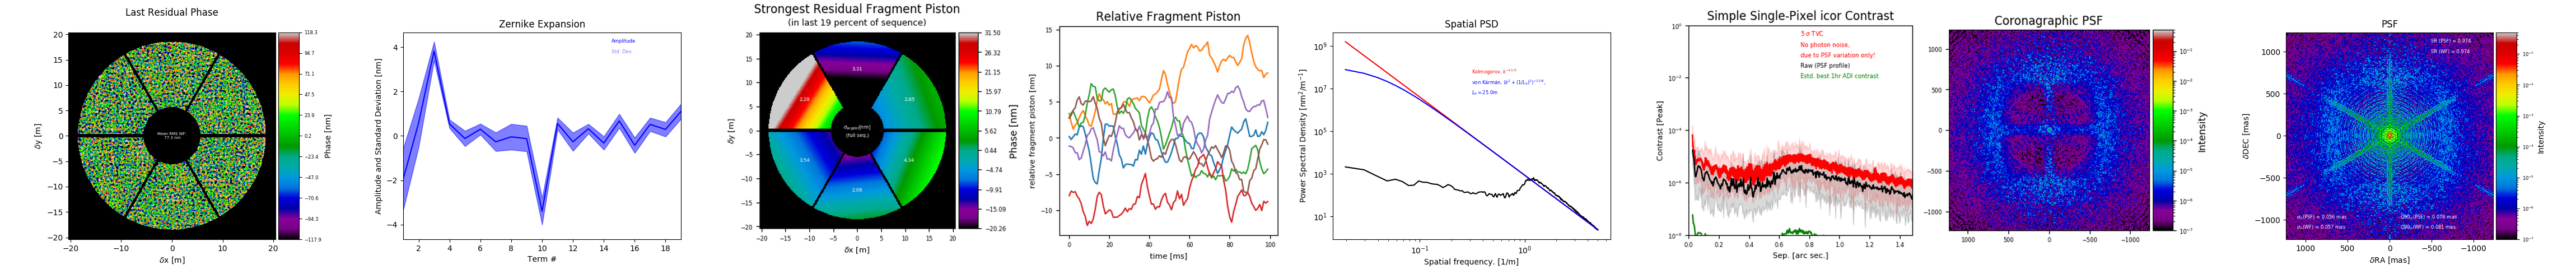
To the rescue comes AOSAT, the Adaptive Optics Simulation Analysis Tool(kit). Run it on the screens containing the residual phase maps and produce either a tearsheet summarizing all the important information at a single glance, do in-depth analysis using specialized analyzers, or extend the package to tie it directly into your simulation code and perform exactly the type scrutiny you require.
Getting Started
General Concept and Extending
Analyzing Phase screens